Business activity monitoring (BAM) with WSO2 Governance Registry
BAM refers to the aggregation, analysis, and presentation of real time information about activities inside organizations and involving customers and partners. The main benefits of BAM are to enable an enterprise to make better informed business decisions, quickly address problem areas, and re-position organizations to take full advantage of emerging opportunities.
BAM solutions often present information on dash boards using various graphs.
WSO2 Governance Registry provides with BAM functionality which enables users to aggregate various web services data and visualize them using dashboard gadgets. In this post, I'll describe how you can add a remote server for monitoring and generate graphs.
Pre-requisites:
Download and install (Unzip the binary) WSO2 Governance Registry-3.0.0-beta1 release from here
We will refer to the unzipped directory, Greg_Home
Step 1
Start WSO2 Governance Registry server by running wso2server.bat{sh} from Greg_Home/bin
Step 2
Access the management console of Governance Registry by using https://localhost:9443/carbon
You can log in to the console with default administrator credentials (admin/admin).
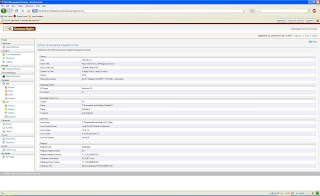
You will be landed in the Home page of WSO2 Governance Registry.
Step 3
As the first step of activity monitoring, we need to add a server from which the data can be collected. In this post, I'll use a WSO2 Web Services Application Server (WSAS) instance running on my local machine as the monitored server.
Click on Monitoring servers at the left navigation of WSO2 Governance Registry console. You will be directed to the Monitored servers page. Click on Add server link to add an external server for monitoring.
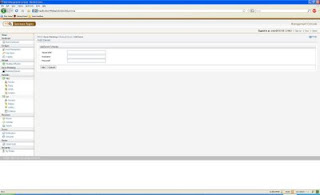
Suppose the WSAS server instance (the monitored server) is running on https port 9444 on my local machine.
Enter the serverURL, https://localhost:9444
Enter WSAS administrator credentials (username=admin, password=admin)
Click on Add. You will get "Server successfully added" message.
Step 4
Now we have added a server instance to monitor. Lets gather the service statistics and configure dashboard gadgets to visualize data.
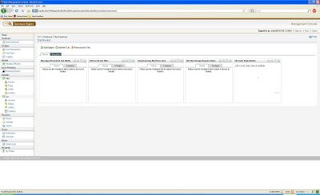
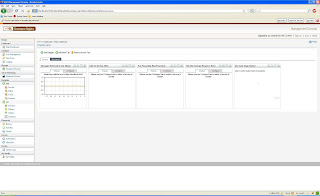
Click on Main Dashboard in the left navigation menu of Governance Registry management console. You will see the Dashboard page as follows.
Step 5
Select the first gadget, Messages received in last minute, and click on configure tab. Select https://localhost:9444 from the server dropdown list.
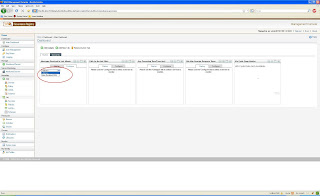
When you select a server from the drop down list, the services list will also get populated, so that you can select one of the services hosted in your server. In this example, I'll use the default HelloService.
Now click on Display tab. An empty graph will be shown as given below.
Step 6
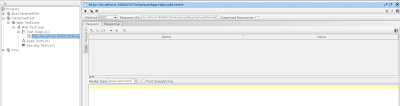
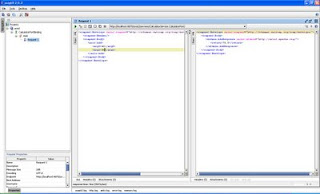
Now, invoke HelloService multiple times (you can use Tryit tool or SOAPUI) and refresh the dashboard.
You will see that the Messages received in last minute graph is being populated.
Similarly, you could try with the other graphs as well.
BAM solutions often present information on dash boards using various graphs.
WSO2 Governance Registry provides with BAM functionality which enables users to aggregate various web services data and visualize them using dashboard gadgets. In this post, I'll describe how you can add a remote server for monitoring and generate graphs.
Pre-requisites:
Download and install (Unzip the binary) WSO2 Governance Registry-3.0.0-beta1 release from here
We will refer to the unzipped directory, Greg_Home
Step 1
Start WSO2 Governance Registry server by running wso2server.bat{sh} from Greg_Home/bin
Step 2
Access the management console of Governance Registry by using https://localhost:9443/carbon
You can log in to the console with default administrator credentials (admin/admin).
You will be landed in the Home page of WSO2 Governance Registry.

Step 3
As the first step of activity monitoring, we need to add a server from which the data can be collected. In this post, I'll use a WSO2 Web Services Application Server (WSAS) instance running on my local machine as the monitored server.
Click on Monitoring servers at the left navigation of WSO2 Governance Registry console. You will be directed to the Monitored servers page. Click on Add server link to add an external server for monitoring.

Suppose the WSAS server instance (the monitored server) is running on https port 9444 on my local machine.
Enter the serverURL, https://localhost:9444
Enter WSAS administrator credentials (username=admin, password=admin)
Click on Add. You will get "Server successfully added" message.
Step 4
Now we have added a server instance to monitor. Lets gather the service statistics and configure dashboard gadgets to visualize data.
Click on Main Dashboard in the left navigation menu of Governance Registry management console. You will see the Dashboard page as follows.

Step 5
Select the first gadget, Messages received in last minute, and click on configure tab. Select https://localhost:9444 from the server dropdown list.

When you select a server from the drop down list, the services list will also get populated, so that you can select one of the services hosted in your server. In this example, I'll use the default HelloService.
Now click on Display tab. An empty graph will be shown as given below.

Step 6
Now, invoke HelloService multiple times (you can use Tryit tool or SOAPUI) and refresh the dashboard.
You will see that the Messages received in last minute graph is being populated.
Similarly, you could try with the other graphs as well.
Comments